This tab pools all those functions and settings, that deal with runtime and log data. In many cases the application must be connected to the ECM to use these features.
After clicking the "Connect" button (plug icon), the connection dialog pops up. Select the port you are using for the connector cable and choose the ECM type installed in your bike. A check button allow to choose, wether the EEPROM shall be fetched directly after a connection to the ECM is established.
The drop down list shows all availabel serial ports (COM ports). COM ports followed by a number greater then 9 can not be used with this application, as Windows will refuse to open them and show an error message instead. In case a FTDI USB to serial adaptor cable is used, the application can also connect directly to the USB port. These ports also show up, their names start with "FTDI TTL232", followed by the cable's serial number. (This option is available with Windows only.)

If an EEPROM copy is to be fetched from the ECM directly after the connection has been made, a progress bar will keep you updated on the progress of reading data from the ECM:

Even with no database activated, it is now possible to connect to an ECM and fetch an EEPROM copy, but only to save the EEPROM data to a file. The application is not capable to adjust such EEPROM data, this still requires a donataion to activate the database. Also, runtime data can be retrieved and stored into a log file now. Later, this log data can be viewed or examined with other appliations as the MegaLog Viewer.
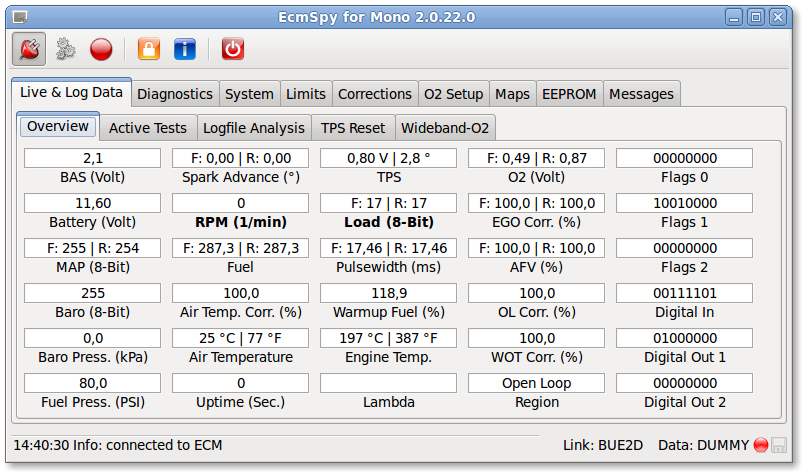
The overview is always shown, when the live data tab is opened the first time, and, as no data is available yet, all entries are empty. Once connected to the ECM and with the "Execute" button (gears icon) pushed, the text fields will then show live data, polled continously from the ECM.
Click image for an unscaled view
A second click on the "Execute" button toggles the button and stops polling live data. Even while polling is active, you can change to other tabs (System, Diagnostics, ...), but it's not possible to start another action that requires a communication with the ECM (e.g. clear trouble codes). In this case, you will be asked if polling live data shall be stopped first.
If a trouble code is set while polling is active, the warning lamp will be switched on also.
The indicators on this page are the graphical counterpars of the "Digital In" and "Digital Out" displays shown in the "Overview" page.

Click image for an unscaled view
A number of (virtual) LED indicate the state of some ECM pins, used for in- and output. Because the polling cycle is comparably slow, very short events (namely coil and injector events) are often lost and won't be shown.
Additionally, device tests can be run on this page. All device tests suitable for a special ECM type are described in the Service Manual. Select a test from the list and click the "Run Test" button. Unless the engine is running or the selected device is not available, a popup will appear while the test is running. The ECM does not send a test result, so it's your task to check if the tested device is working as expected. Please note, that tachometer test can not be performed on CAN-bus connected devices (e.g. 1125 instrument clusters).
To write runtime data to a file for later analysis, click the "Log" icon. Each time, logging is requested, a new file will be created in the "megalog" subdirectory of the application's data directory. The filename contains a timestamp to aid in finding the right file. The filename is shown in the status bar as well as in the messages window. EcmSpy is writing a binary (extension .bin) and a textual (extension .msl) log file. Text files can be opened with a software like spreadsheet applications or the MegaLogViewer, while binay files must be converted to text files before, but require less disk space. Binary log files from EcmSpy for Palm PDA or EcmDroid are also supported.
Analyze Runtime DataIf a log file is available, it can be used to (basically) check the O2 sensor. It's very important to cover the closed loop area as good as possible. The engine and the O2 sensor must have reached their operating temperature, therefore the distance ridden should not be less than 25 mls or 40 km, and the duration not less than 30 minutes.

Click image for an unscaled view
O2 sensors are subjects to wear, and their responsiveness as well as the variation in voltage drops. On this pane, a narrowband O2 sensor's data will be read from a log file and statistically evaluated. The distribution of the O2 sensor voltage on the three voltage ranges (rich, lean and error voltage range) allows for a very basic estimations of the O2 sensors functionality. With increasing age the percentage of values in the error voltage range will rise, same as the average lean voltage, and the average rich voltage will drop.
If the "Real Time" check button is marked, reading of the log file will be slowed down to real-time speed. All data read will also be shown on the "Overview" and the "Active Tests" tabs.
Also, while reading a log file, the dynamic maps are filled with data for fuel map adjustments. An unbalanced distribution of EGO correction commonly indicates a fuel map that is not well adapted to the engine's demands.
If wideband O2 sensor data is available in the log file, the average lambda data will be written to the appropriate dynamic maps and shown on the overview page.

Click image for an unscaled view |
|
When the log file is read, the air and engine temperature values are checked for excessive fluctuation. If temperatures differ more than 3.5 °C (app. 6 °Fahrenheit) between two successive data records, a note will be stored in the messages window. Frequent occurence of such messages can indicate a temperature sensor or cabling error. A visual check of the temperature curves is recommended.
Additionally, data records are evaluated for their time lag. If the lag exceeds 2 seconds, a message will be added to the messages window. Frequent occurences of such messages indicate a bad or noisy connection between the PC and the ECM. Wireless Bluetooth connections are by trend more stable and less noisy than wired connections.
Vehicle voltage, as reported by the ECM, will be looked over, too. When hitting either the upper threshold of 16 volts or the lower threshold of 11 volts, a message is added to the messages window. Very frequent occurences of these messages strongly suggest an inspection of the vehicle's electrical system.
Wideband O2 sensor data will also be checked for interruptions or sensor errors, when present in the log file. Such events will be logged to the messages window and application log and the error lamp will be lit.

Click image for an unscaled view
To perform a TPS reset (DDFI and DDFI-2 only), follow the instructions and push the "Reset" button. The TPS voltage signaled to the ECM with a fully closed butterfly will then be stored in the EEPROM. The entry "TPS Zero Voltg." shows the value stored in the EEPROM, not the actual TPS voltage. This can be looked up at the "Overview" tab.
DDIF-3 type ECM do not require a TPS reset of this kind. To perform a TPS reset for such bikes please follow the instructions in the service manual.

|
|
Please note: the current TPS voltage will be displayed in the "TPS Voltage" field, as soon as runtime data are retrieved. The TPS reference voltage, as stored in the EERPROM, is shown in the "Zero Voltage" entry.

Click image for an unscaled view
EcmSpy supports up to two wideband O2 sensors, logged simultaneously with ECM live data. To enable wideband logging, select the manufacturer from the upper and the serial port, the wideband sensor is connected to, from the lower list. Currently Innovate and PLX are the only manufacturers supported. Then toggle the "Activate" button to start reading wideband data. As soon as live data aquisition is switched on and logging to file active also, wideband O2 sensor data will be added to the log file.
Please note: lambda data will appear in the text file (.msl extension) only!
During a test ride it's usually impossible to watch wideband O2 sensor output. In case the O2 controller signals an error or another event that prohibits to measure the exhaust gas O2 level, this is also stored in the log file.
AFR is always stored as AFR = lambda ∗ 14.7, when the O2 sensor is working properly.
A negative AFR indicates an event, that made it impossible to get a valid lambda value, as shown below:
| AFR | Lambda (λ) | Meaning |
|---|---|---|
| -1 | 17.0 - 20.9 | O2 level too high λ = O2 level in % |
| -2 | 0.0 | Free air calibration in progress, λ is ignored |
| -3 | 0.0 | Free air calibration required, λ is ignored |
| -4 | 0 - 100 | Warming up, λ = % of the operating temperature |
| -5 | 10 - 0 | Heater calibration in progress, λ shows calibration countdown |
| -6 | error code | General controller error, λ shows error code. Please consult your O2 sensor manufacturer's documentation. (*) |
(*) If you get frequent and reproducable sensor timing errors in overrun conditions when using a LC-1 device, contact Innovate and ask for firmware version 1.2 which fixes this error.